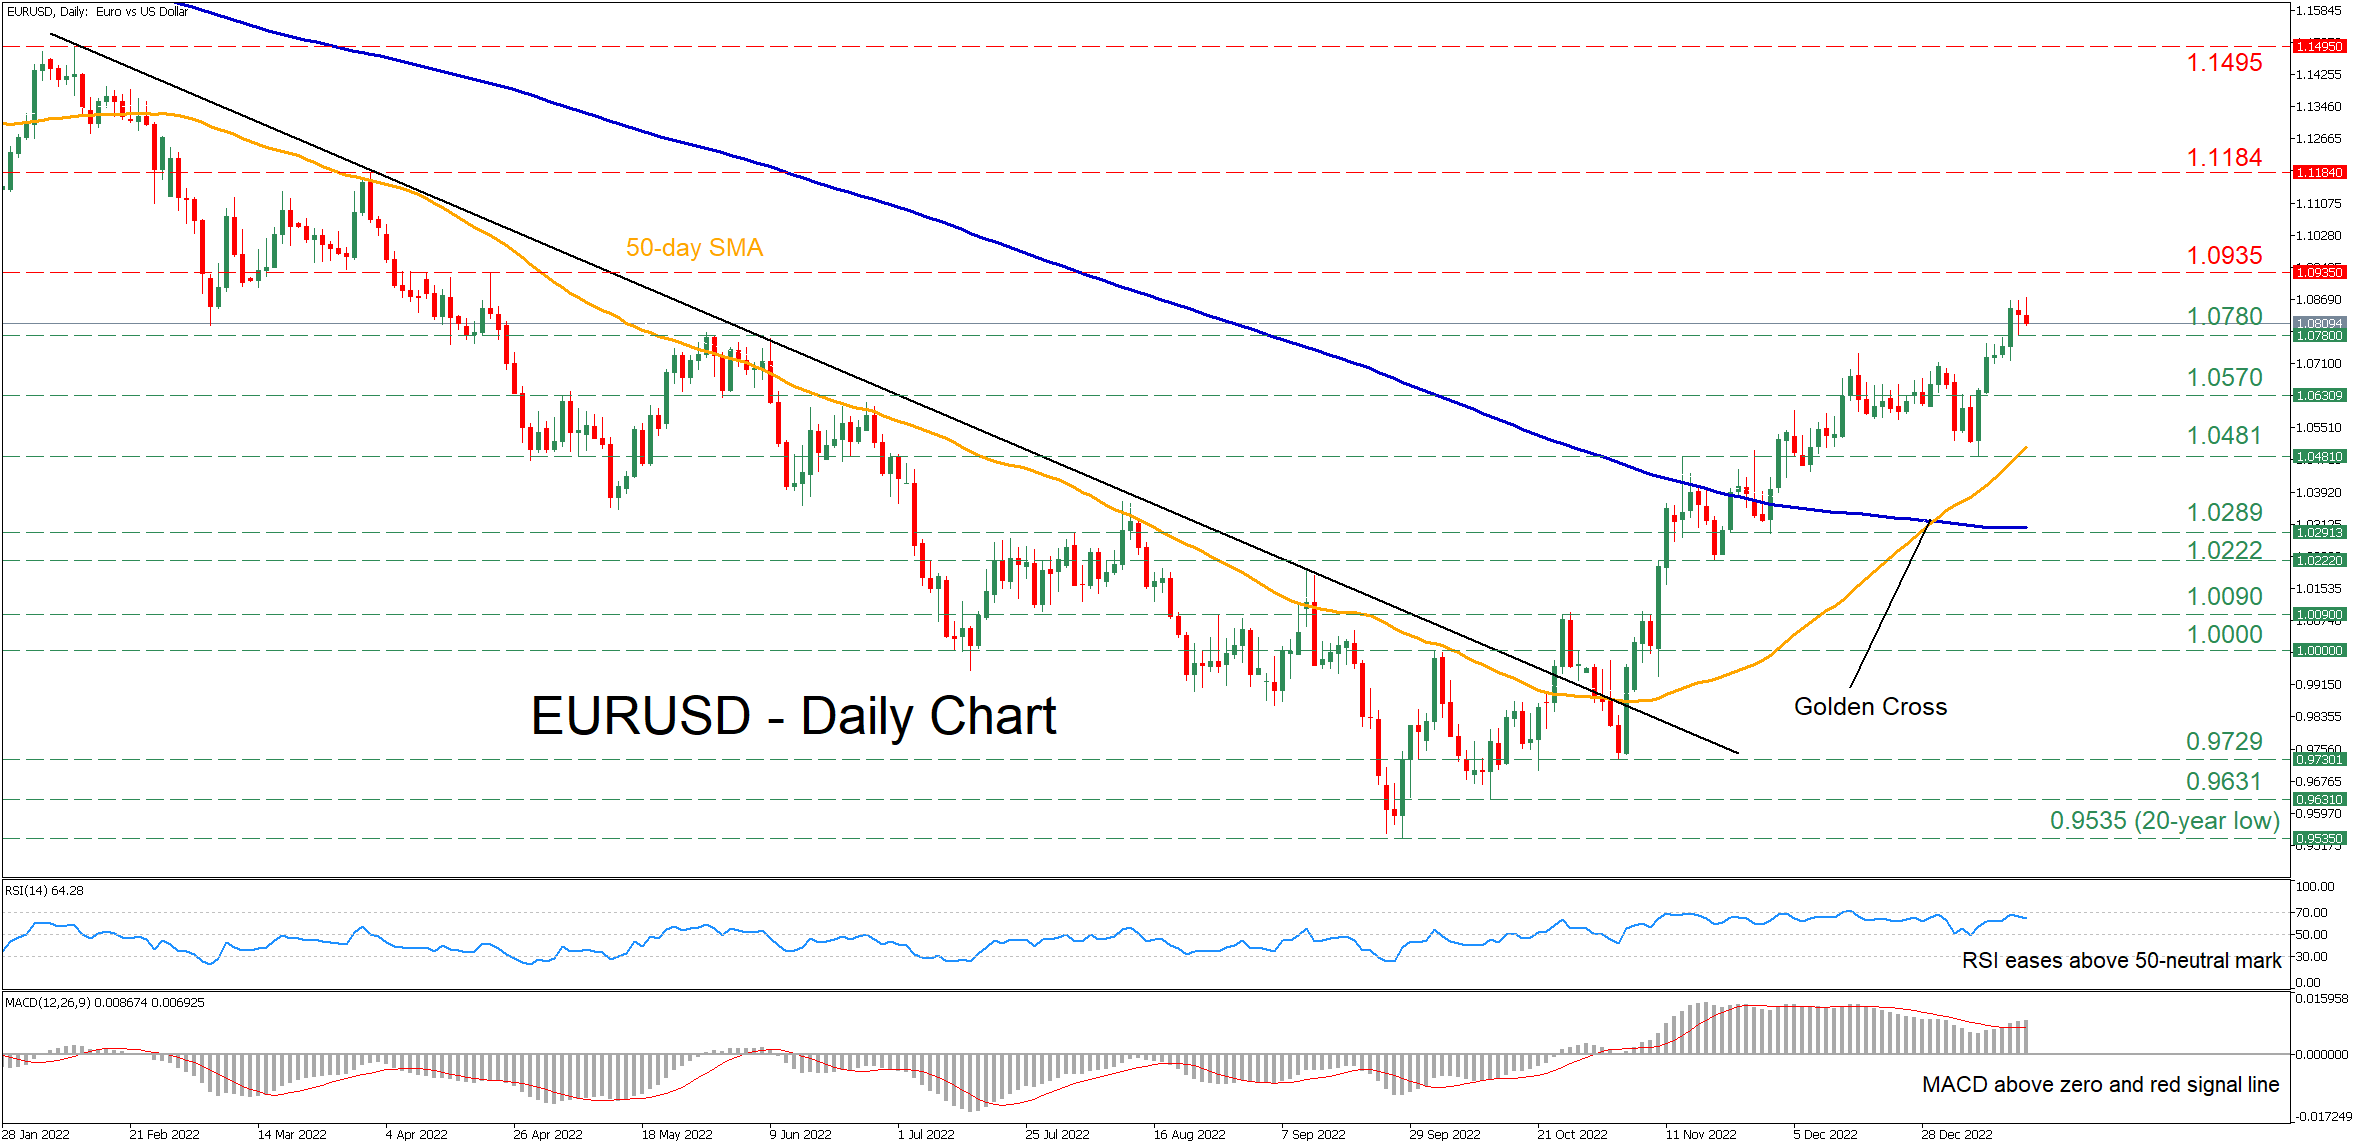
EUR/USD Technical analysis daily chart.
EURUSD has been attempting a strong rebound since early October when its steep downtrend came to a halt at the 20-year low of 0.9535. In the last couple of daily sessions, the pair recorded a fresh 8-month peak, extending its medium-term pattern of higher highs and higher lows.
The momentum indicators currently suggest that bullish forces are in control. Specifically, the RSI has flatlined in the positive region, while the MACD histogram is strengthening above both zero and its red signal line.
Should buying pressures persist, the pair could ascend towards the April resistance zone of 1.0935. Conquering this barricade, the bulls could then aim for the March high of 1.1184. A break above the latter may trigger an advance towards the February peak of 1.1495.
On the flipside, if the pair experiences a downside correction, immediate support could be encountered at 1.0780, which also acted as strong resistance in May. Diving beneath that region, the price could test 1.057 before the recent low of 1.0481 comes under examination. Failing to halt there, the November support of 1.0289 might provide downside protection.
In brief, EURUSD appears ready to extend its recovery as near-term risks remain tilted to the upside. However, the pair could experience a consolidation phase before its advance resumes


